Global Search
The search engine for railway.
Get targeted results from all across your network, sorted by type, location, severity, and a wide range of other attributes.
Learn More

Explore our
Automated Data Pipeline
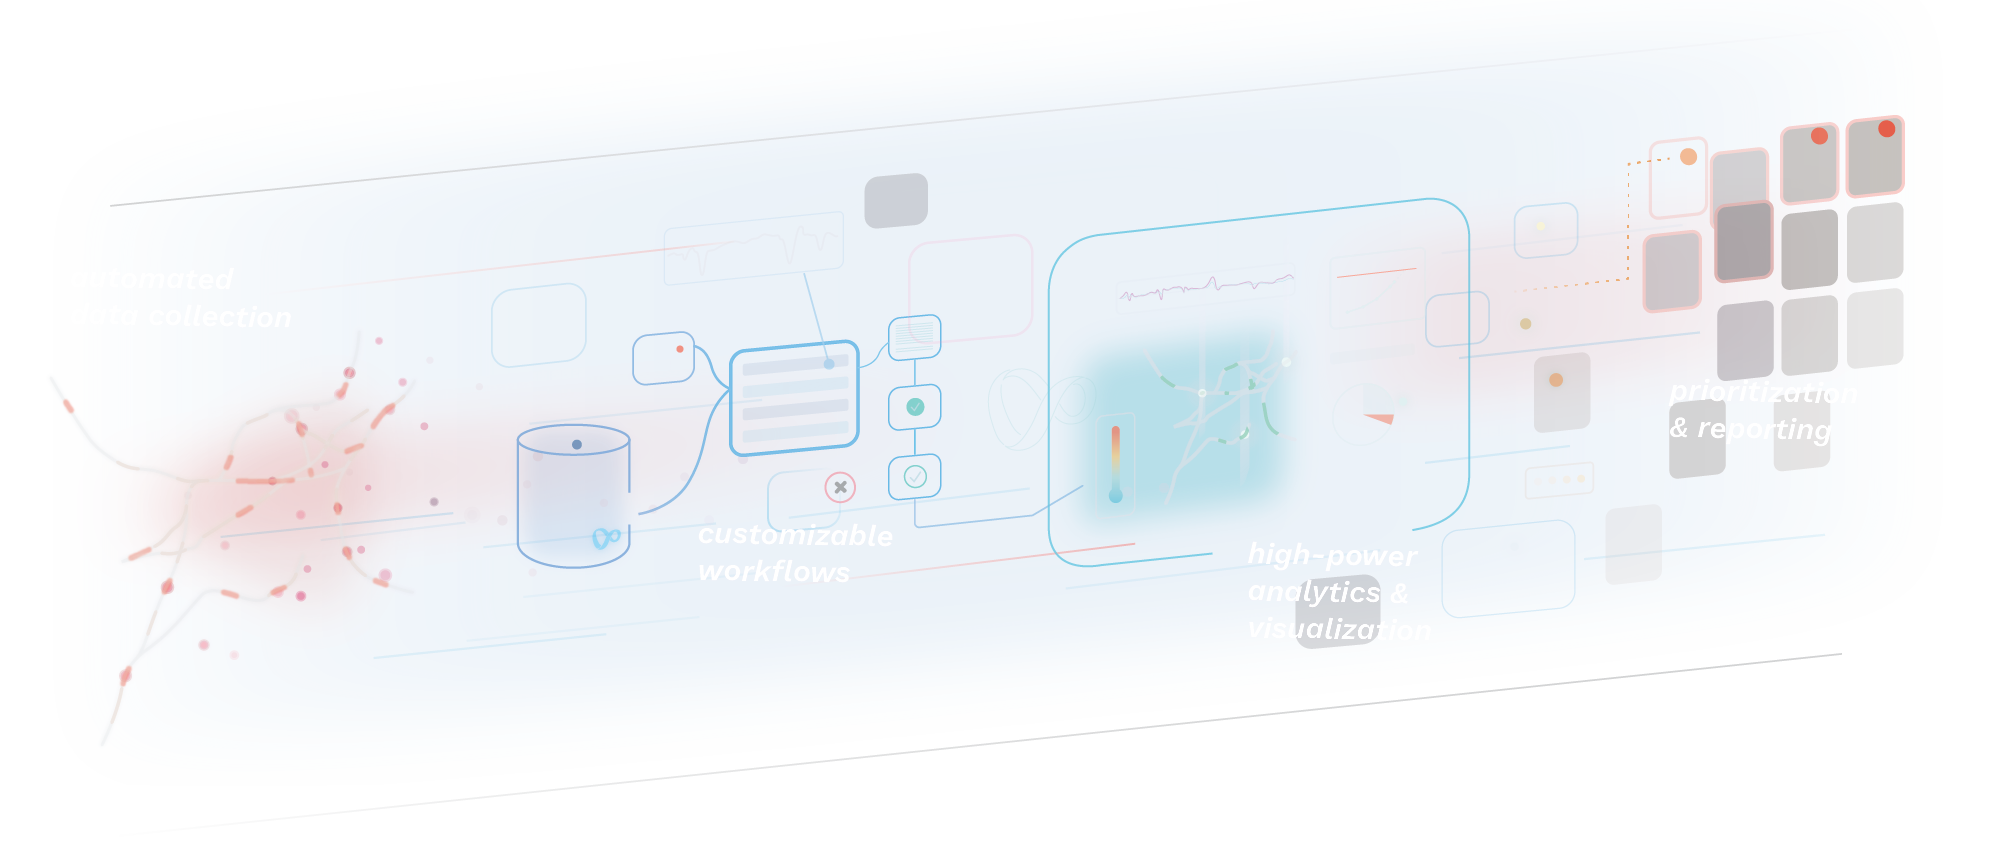
From receiving file uploads to pushing notifications for time-sensitive conditions, automated workflows throughout our data pipeline handle the ever-growing volumes of railway data.
Explore the Data Pipeline

Predictive Analytics
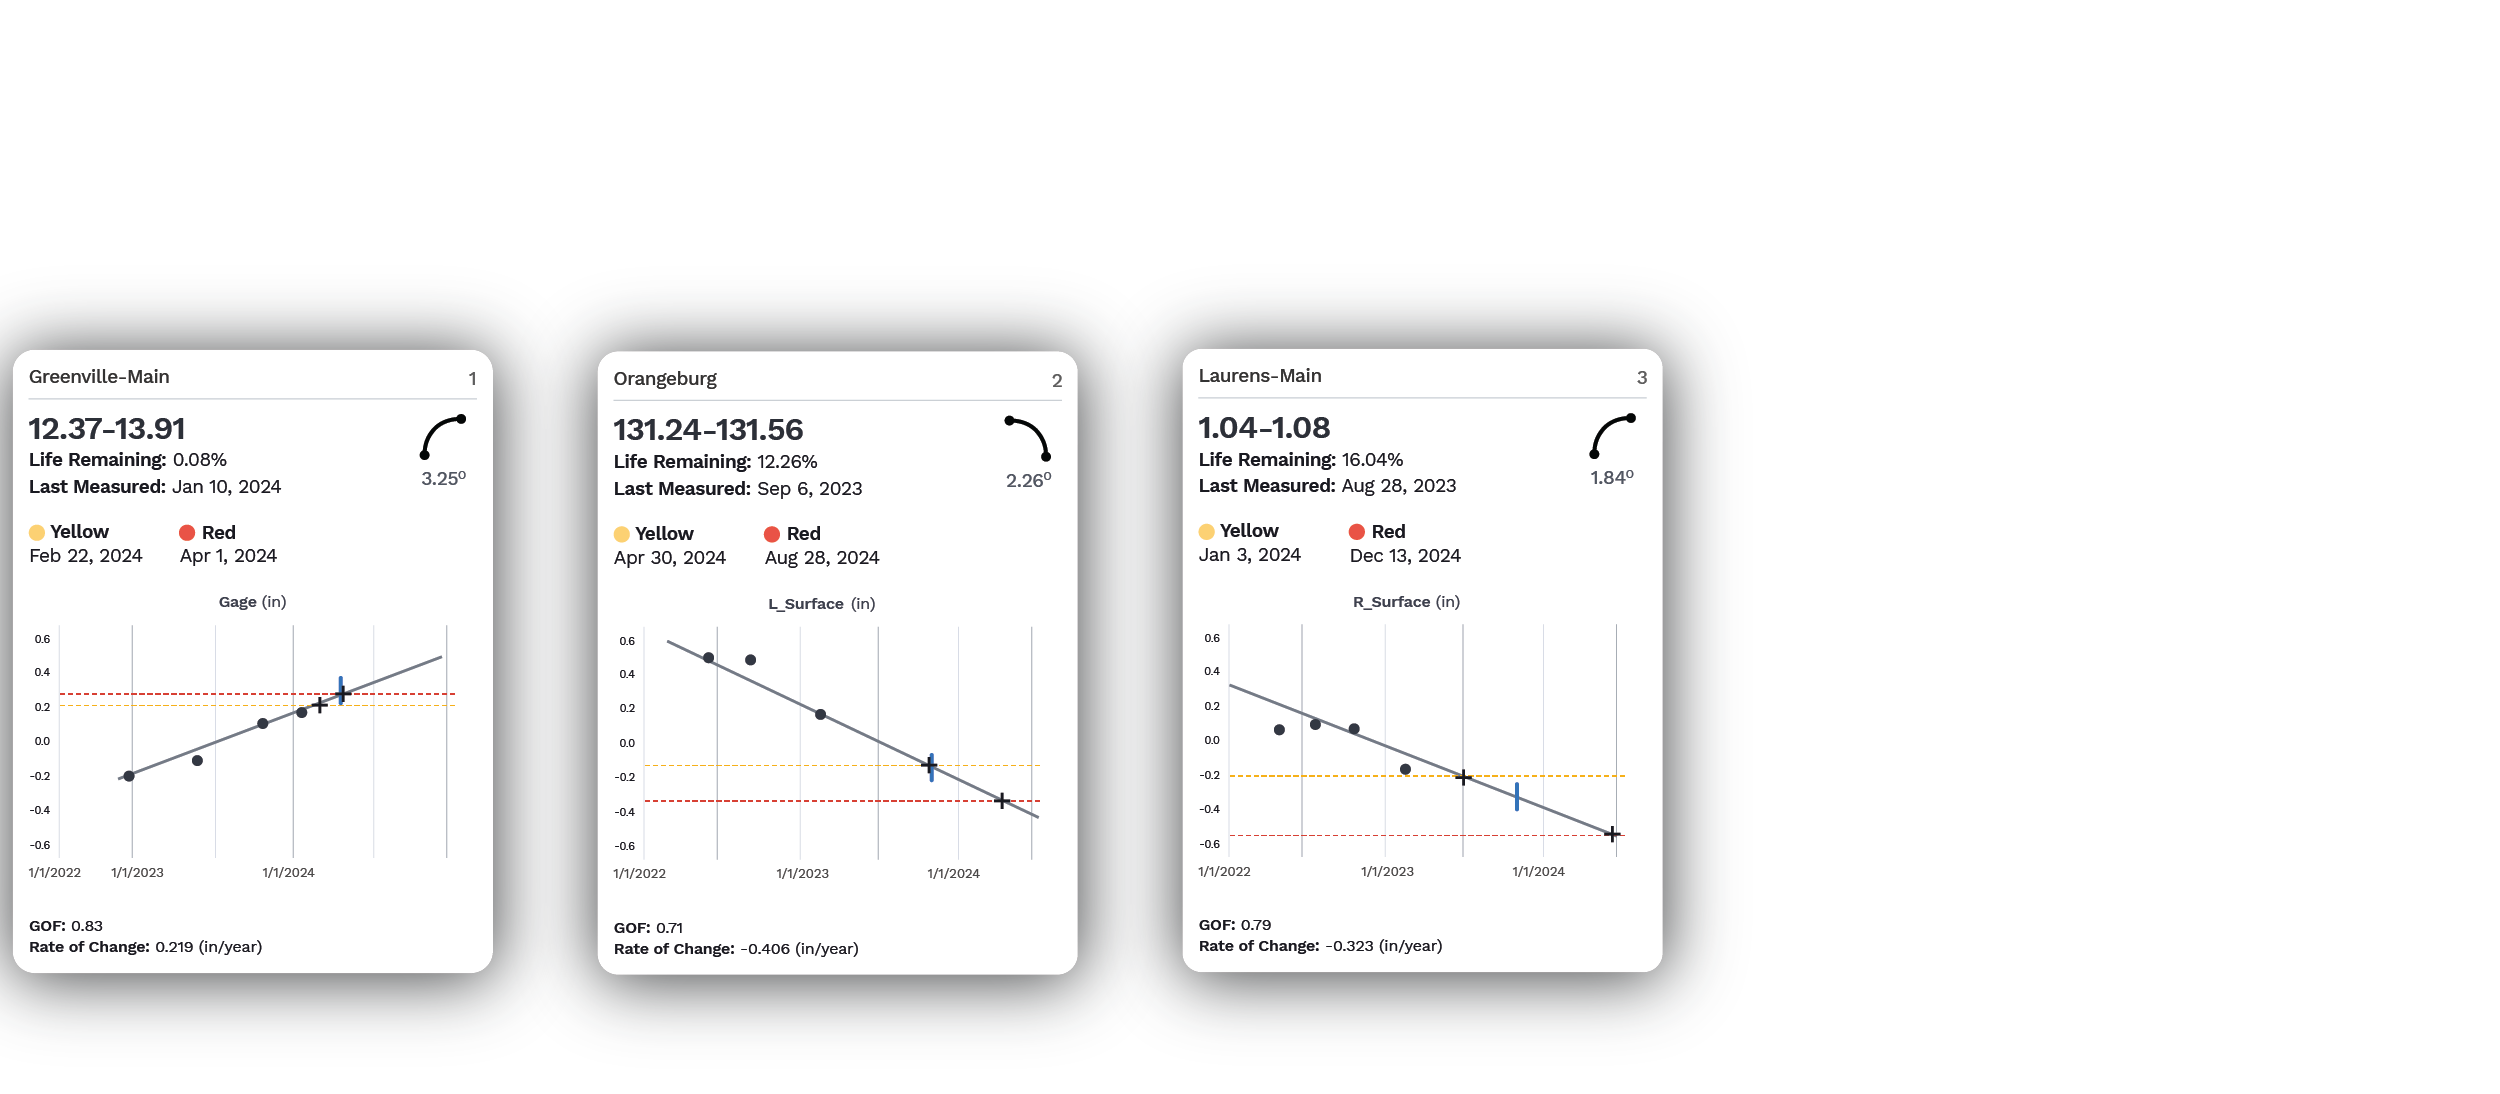
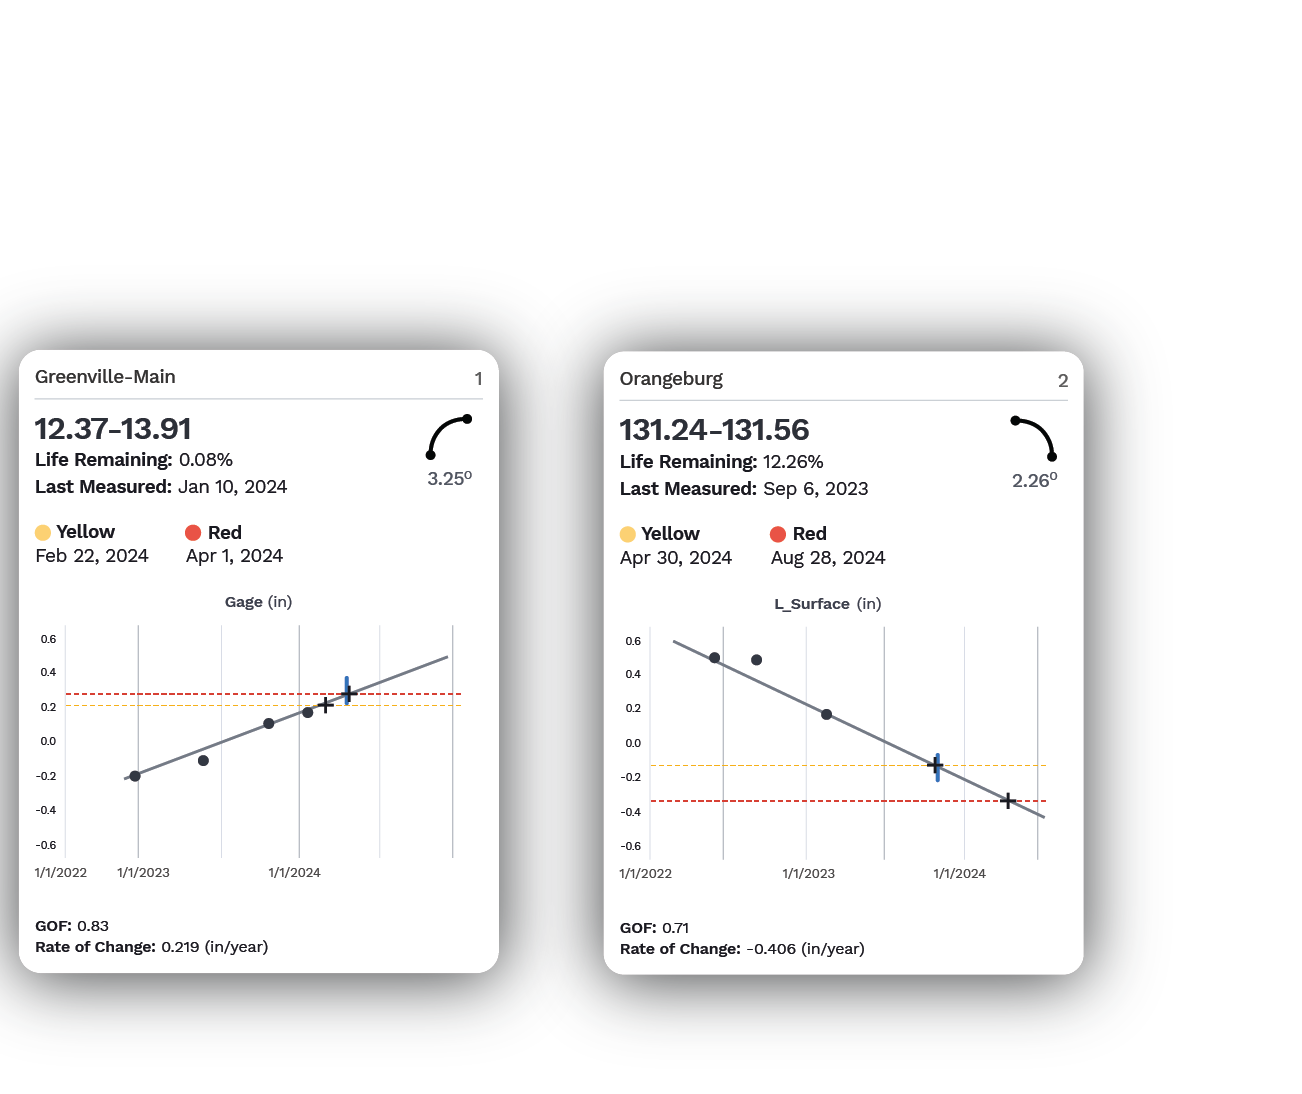
Through careful tracking, processing, sorting, and labeling, we can highlight the worst-trending areas of track, providing a precise, data-driven alternative to relying on defect thresholds or regular schedules.
Learn More

High-Power
VIsualizations
For us, raw data processing is only the beginning. Our focus on clear, intuitive visualization allows new insights and questions to pop out, rather than staying hidden in lists and tables.
Experienced, proven, trusted.
VisioStack was founded in 2011 to create the first cloud-based platform that could leverage any condition, asset, or operational data for railways. We've worked with dozens of railways in the years since, building on decades of industry experience, and we're still propelled by the same basic mission: Railway data can be managed better.
Read Our Story
200,000 km under management
Our Track Record
21
countries

6.5 million
virtual machines deployed
--------------
over
5 million
assets imported

25,000,000 km
of data runs

VisioStack has successfully completed SOC 2 assessment using trusted third-party assessor A-LIGN, ensuring our compliance with industry-standard best practices and demonstrating our commitment to data security.


