
Explore the VisioStack
DATA PIPELINE
Manage railway maintenance and risk. Channel the endless stream of data into focused, actionable insights.
Explore the VisioStack
DATA PIPELINE
Manage railway maintenance and risk.
Channel the endless stream of data into focused, actionable insights.
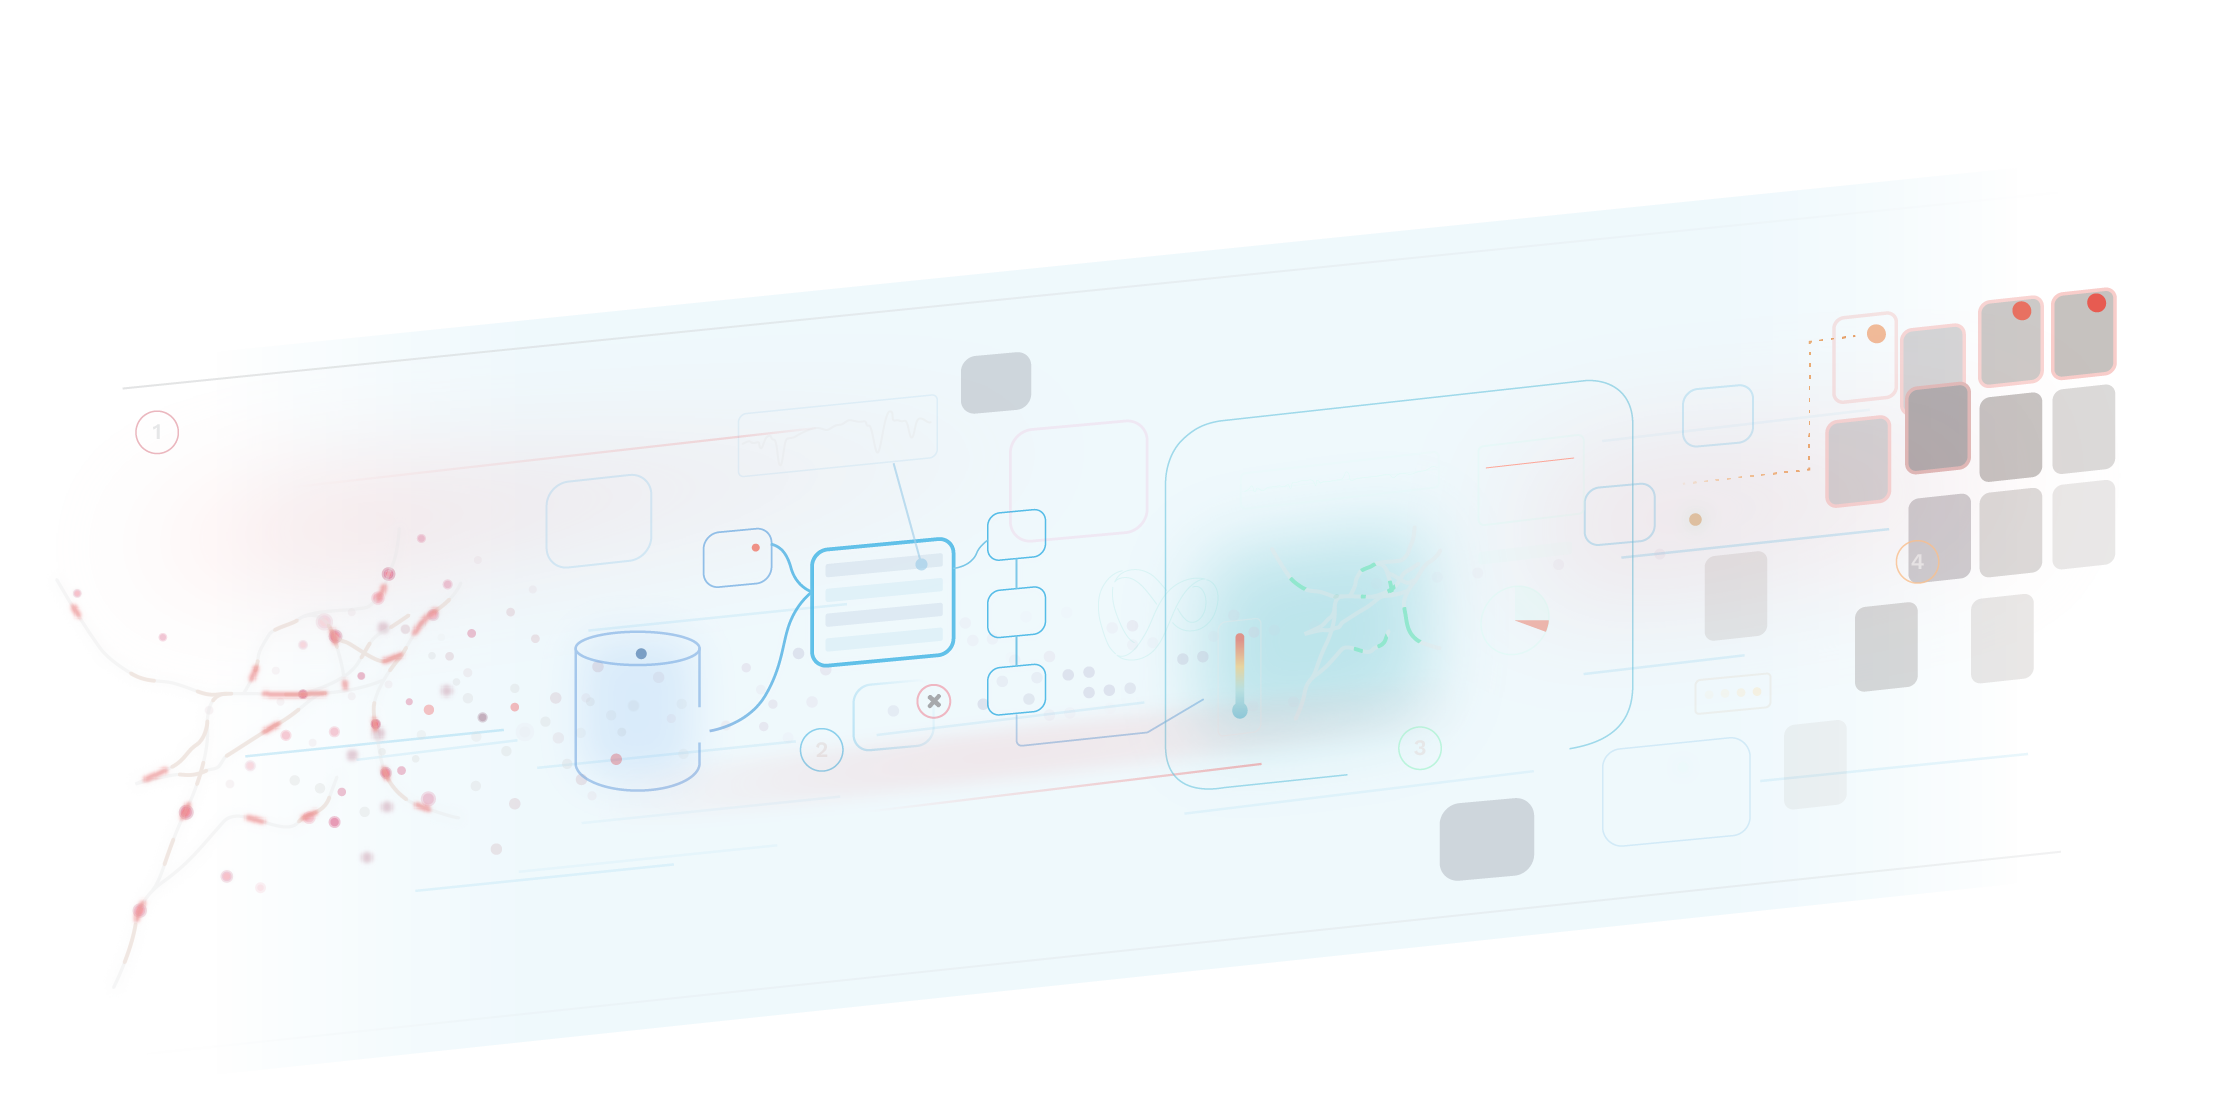
data collection


Rail profiles, track geometry, forward-facing video, LiDAR imagery, drone inspection—you name it. As sensors and formats proliferate, the continuous pileup of data can quickly become overwhelming. It also leaves a risk that the most important information will slip through, unnoticed.
Our process begins with this wide variety of data formats and organizes them into a single data architecture. In essence, this allows various data types to “talk” to each other, rather than being assessed individually.
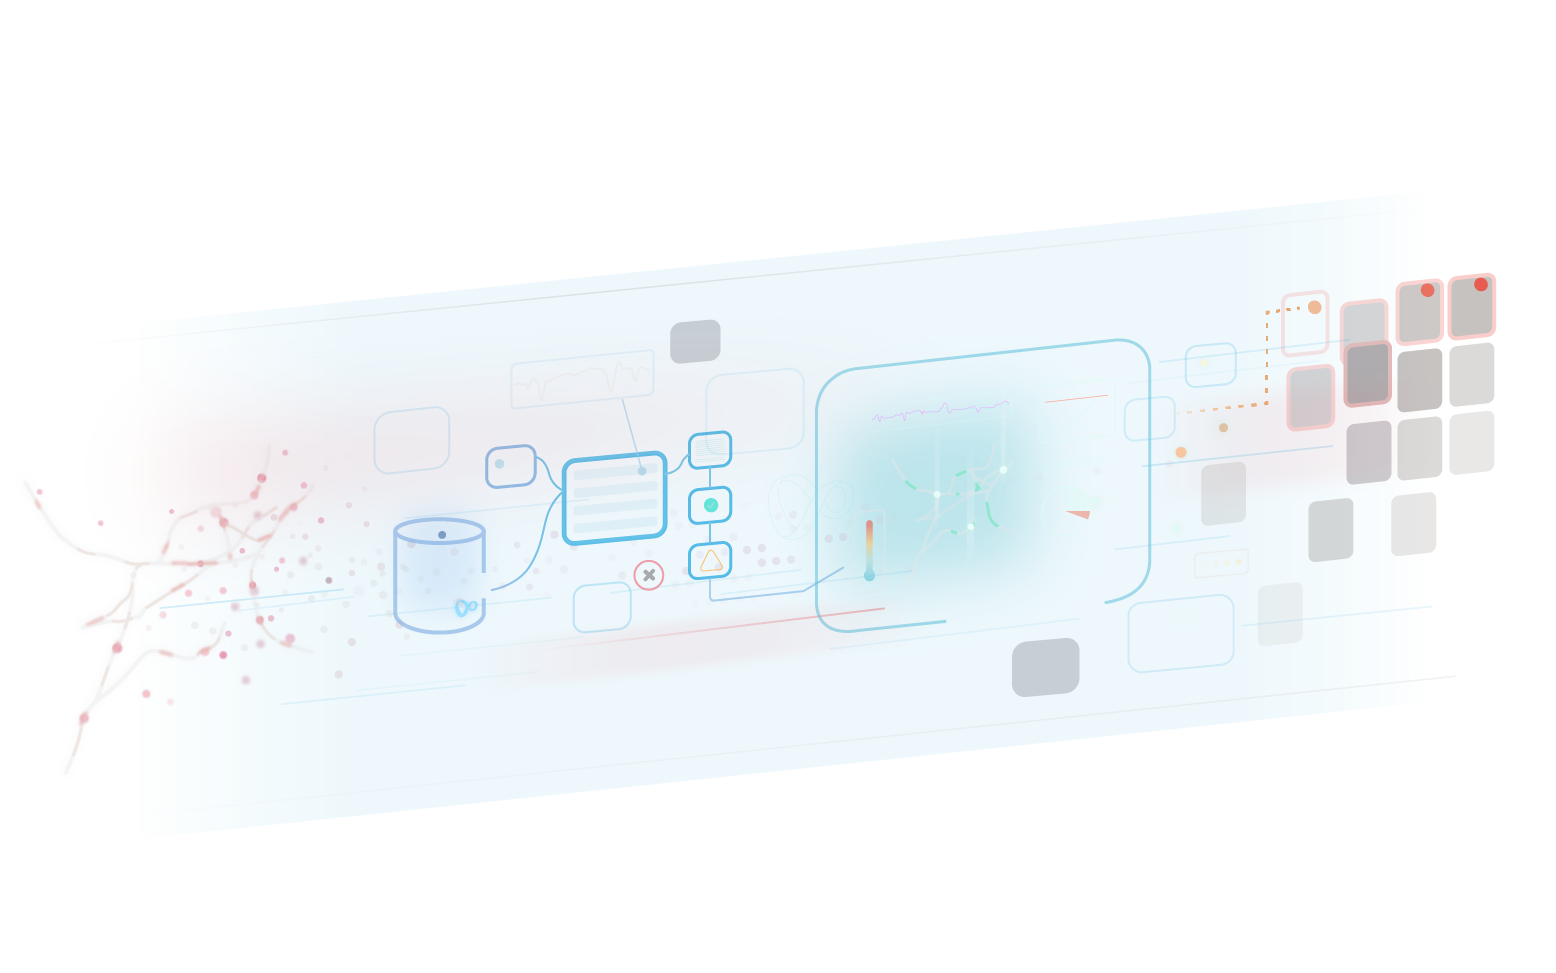
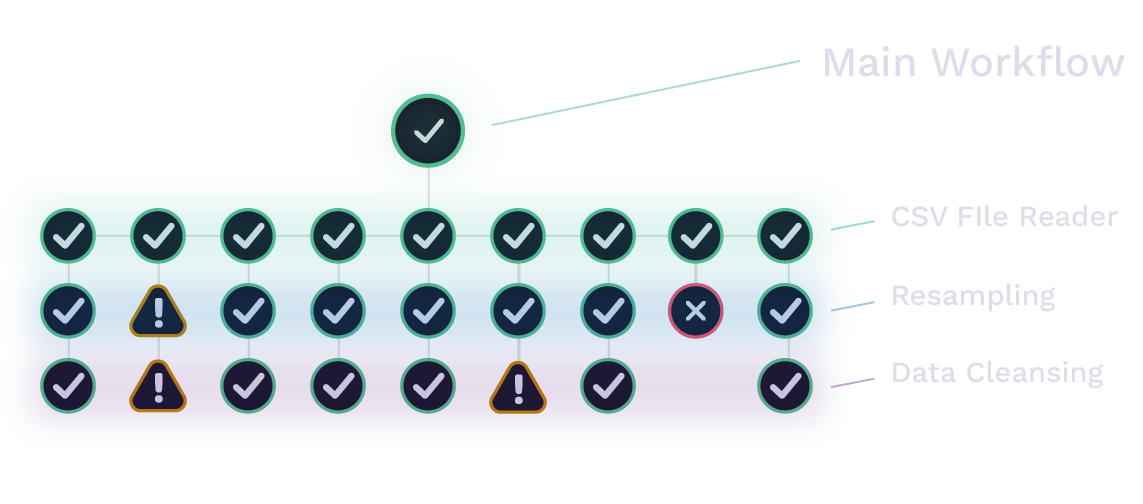
workflows


As part of the uploading process, plugin workflows automatically cleanse and sort data, label attributes, and detect changes. Custom data formats can be handled with customized plugins that allow specialized data to integrate with the rest of the system.
These workflows can be “mixed and matched” based on your particular business needs or goals. For example, a plugin could be added to deal with particularly bad data or integrate weather-related information from an additional sensor.
analytics &
visualization


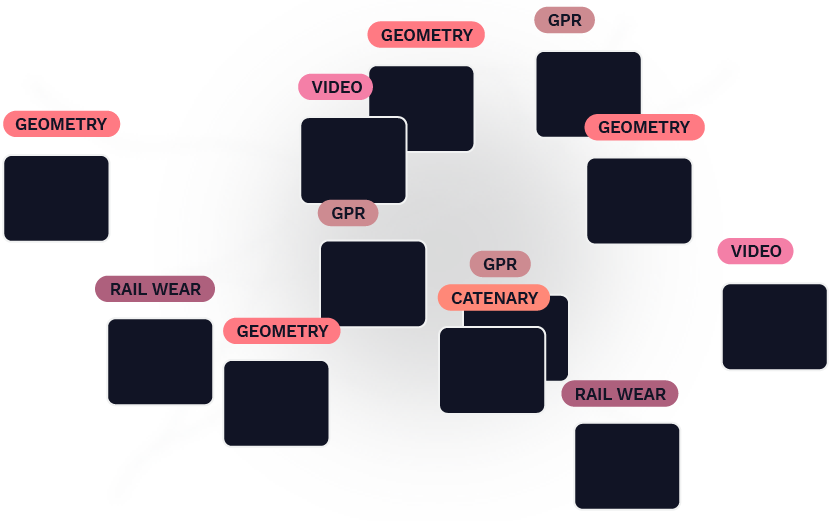
After the new data is fully processed, high-power analytics compare historical trends and visualize trendlines to identify the most urgent areas for maintenance.
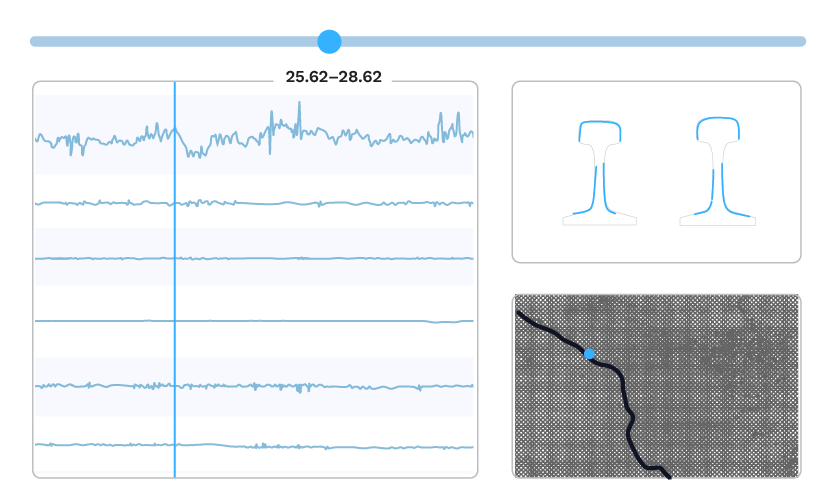
Once these areas are identified, the RailLinks Workspace brings together the various data streams—current and historical track geometry measurements, rail profiles, imagery, and a satellite map view—into a single dashboard, giving maintainers a synchronized snapshot of any given point on the track.
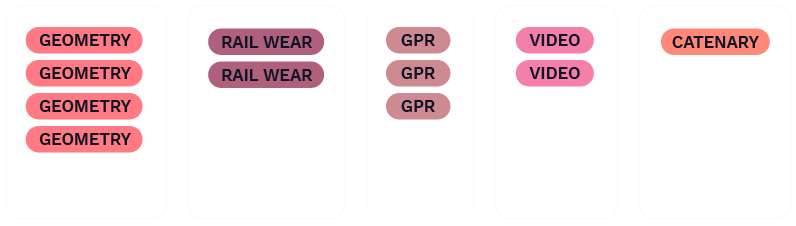
& reporting


Our Global Search function makes finding and prioritizing these urgent areas easier than ever, allowing users to perform tailored searches of the entire data repository. In Global Search, customized filters combine parameters like rail type, region, last planned maintenance, or current wear to give a hyperfocused view of the rail network.

Learn More
In addition to the desktop platform, the RailLinks Mobile app allows field personnel to work on location, uploading data in real time and sharing time-sensitive notifications immediately.
As a whole, the VisioStack data pipeline unlocks fresh clarity and visibility, helping to identify urgent needs and plan safe, efficient rail maintenance.


