Store and visualize condition data with RailLinks® Infrastructure

GIS Asset Perspective
Start with a solid foundation
The cornerstone to successful railway asset management is an understanding of linear relationships between assets. RailLinks Infrastructure can import this structure from existing GIS data sources or construct the foundation from available data sets. We provide a series of tools that allow visualization, validation, and modification management of the railway network from a geographical perspective.
With the onset of Autonomous condition monitoring systems, correlating vehicle movements to the asset foundation is a must. RailLinks Infrastructure's GIS asset foundation ensures that the right condition data is correlated to the right asset.
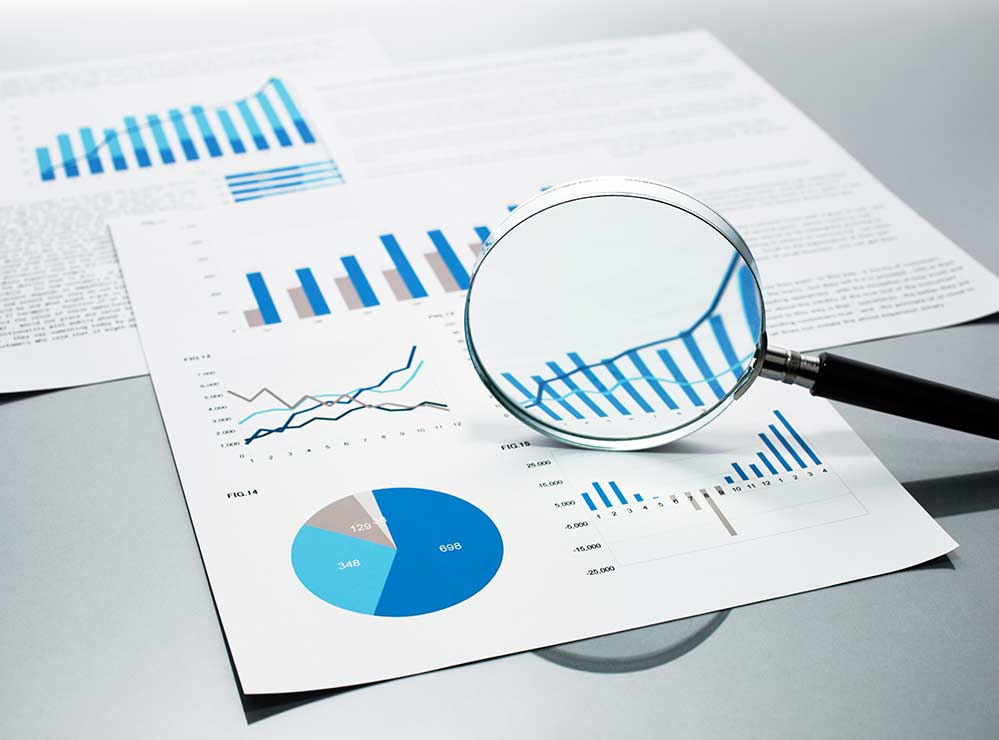
Data Traceability & Quality Analysis
Every byte accounted for
Your investment in condition monitoring systems must be accounted for. Any data set that is not producing quality data, or has not been located against an asset is a lost opportunity. RailLinks Infrastructure's Data Traceability and Quality Analysis tools ensure that any data loss is tagged for review. Our analysis tools recognize when common data like track geometry does not conform to typical patterns, and tags the condition event for manual analysis.
Our data traceability tools ensure that every byte is accounted for, from data ingestion to active results within the platform.
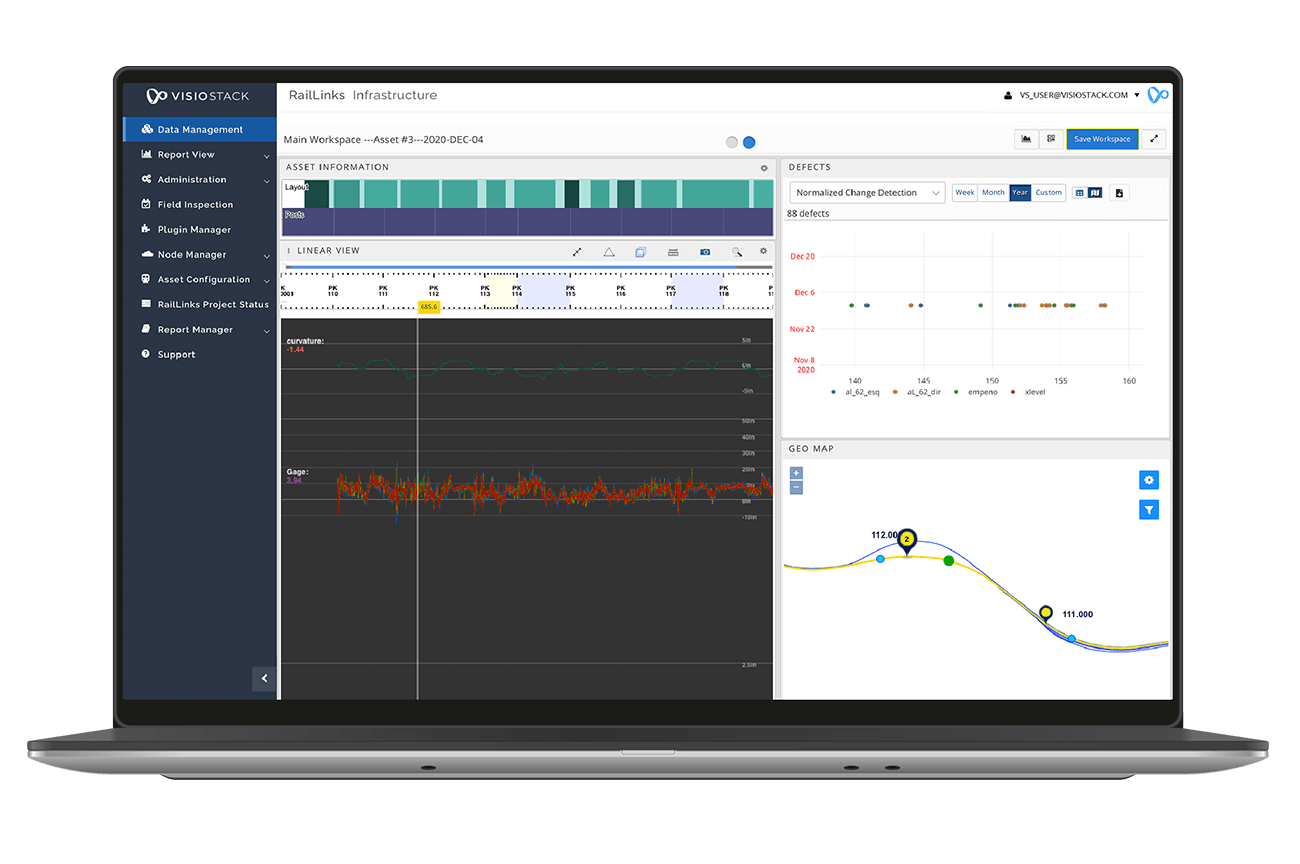
Condition Data Visualization
Multiple dimensions in a single view
Our condition data dashboards allow users to see complex, multiple dimensions in a single visualization. A first in the industry, our Data Management macro view assembles key performance indicators, asset structure, condition data sources, time dimensions, condition data coverage, and workspace configurations into a single interactive report. Users can interact with both asset and condition to formulate the desired workspace and save for future use.

Customizable Workspace
Configured according to business needs
RailLinks Infrastructure allows each user to configure the workspace according to their unique business needs. Linear Data can be synchronized with maps, point clouds, and imagery to create user customized visualizations. Linear strip charts can be configured with parameters, colors, channel sizes and graph types according to a user's preference. Widgets within the workspace interact with each other and interactions are highly customizable.
Our visualization methodology gives you the ability to drill down from a macro level directly to the underlying data, with unprecedented Big Data visualization performance.


Corrective Maintenance Reporting
Focus on prioritized tasks
RailLinks Infrastructure can either ingest defects or create defects through dedicated plugins. All defects are stored in interactive reports that can be recalled through cloud workflows for additional root cause analysis. Defects can also be sent to RailLinks® Mobile platforms for field users. Our flexible API's allow RailLinks Infrastructure to easily synchronize defect state with external systems, ensuring that reports are always up-to-date.
Condition defects can be visualized with asset configuration attributes, in-line with raw condition data, in maps, or in tabular reports.


